Exactly how large is the US HVAC market?
Expert estimates run from $20B to $300B and none of them is right. No single answer is right here and we split the market into four layers to attempt a partial solution. We build estimates bottom-up and top-down, which yields an estimate of $175B of US end-customer spend in 2025. Then, we dive deeper into the data-center slice that drove 2025's growth, plus we compare the widely-quoted technician-shortage story against federal data.
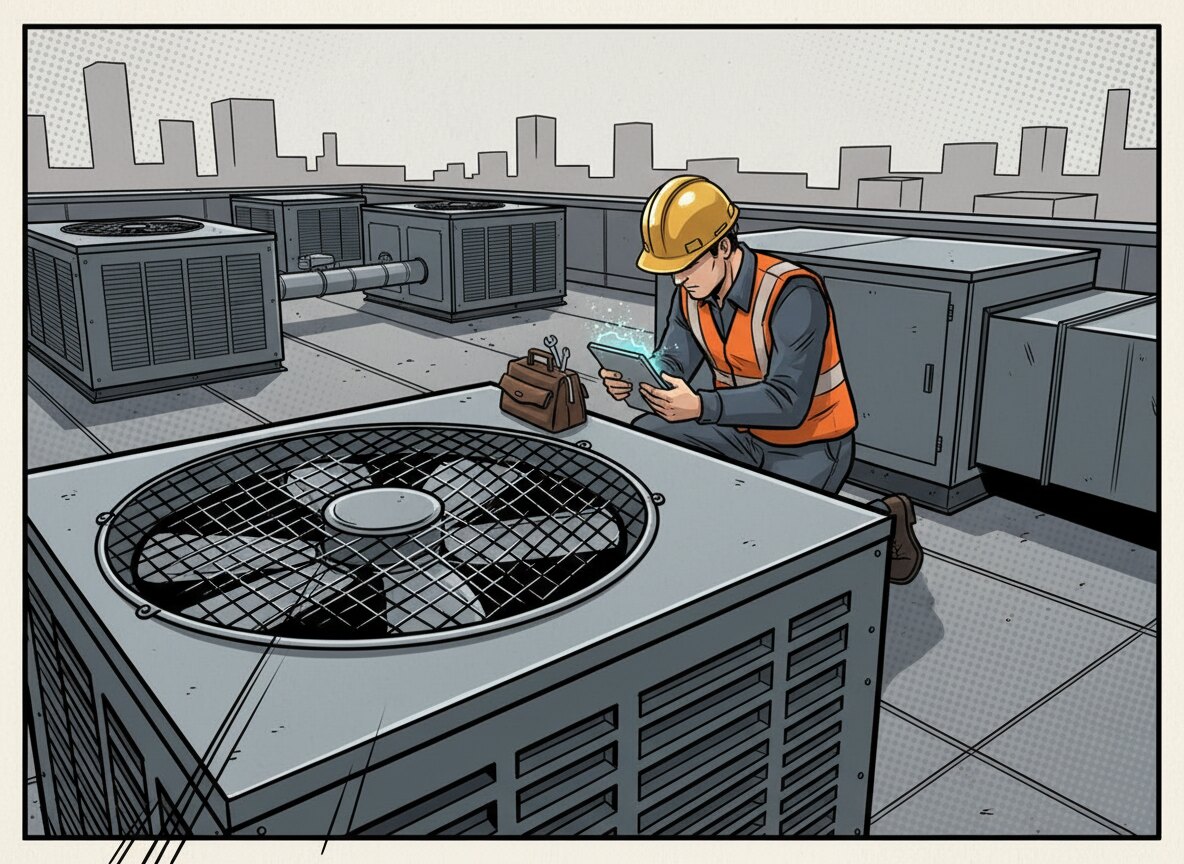
Sizing the US HVAC market through a quick Google search or AI prompt proves unsuccessful. Sources vary by more than an order of magnitude, from research firms quoting $20B, agencies guessing $45.5B, all the way to $106B, $158B and even $298B, all quoting to size "the HVAC market". Even after dropping the outliers, serious-looking figures differ by a factor of 2-5.
In the following, we attempt to understand why these figures (and the ones our AIs gathered) vary so drastically and whether our own estimates land anywhere close to these figures. Since we're technologists, not market analysts, a fair warning as to the accuracy of the presented data is in place. Read on at your own risk.
One air conditioner, four prices
Who's involved in the HVAC value chain? First, a manufacturer (OEM) sells a condenser to a distributor, who then sells it to a contractor, who installs it for a homeowner or building owner, adding labor, margin and, later, service. Those are four layers whose revenue each includes the layer before it. Practically, this means that a condenser that leaves the factory at $1,800 shows up as about $2,450 of distributor revenue and $4,000+ inside a contractor's invoice. Only the last of those is money a customer spends.
| Layer | Players | Size Estimate |
|---|---|---|
| Factory | OEMs (Trane, Carrier, Lennox, Daikin, …) | $47–72B¹ |
| Distributor | Wholesalers (Watsco, …) | $74–106B² |
| Contractor | HVAC contractors | $158.4B³ |
| End customer | Homes and buildings | ca. $175B ($160–195B)⁴ |
| All layers added up | nobody | $320–350B⁵ |
¹ Census factory shipments by industry code (NAICS): from 333415 ($47.4B in 2024; includes commercial refrigeration, excludes imports) to 3334 in Census's monthly manufacturers' survey, M3 (ca. $71.6B, our sum of the monthly figures; adds fans and heating).
² Watsco's North American estimate ($74B) and IBISWorld's two US figures ($76.0B, $105.9B).
³ IBISWorld.
⁴ Our estimate. Above the contractor layer because OEMs sell some commercial equipment and service directly.
⁵ OEM (M3, $71.6B) + distributor + contractor + OEM direct service. Not a market size.
So "the HVAC market" is at least four different numbers. The ca. $150–160B usually quoted as "the HVAC industry" is the contractor layer. Only the last layer is the market without any double counting.
Why the published numbers differ 2–5x
The spread is not real disagreement about the economy and it comes, maybe unsurprisingly, from choices of scope (and maybe one bad habit), in particular:
- Layer. As above, i.e. factory, distributor or installed price.
- Services in or out. Take them into account (or not) and this alone can roughly double a figure.
- HVAC vs. HVACR. Two overlapping, but different markets. HVACR is if you include commercial and transport refrigeration and water heaters.
- Geography. The US is not the entire North America market, but almost (10–15% difference).
- Product scope. Freedonia's narrow product list gave $20.7B (2018). Others add controls, ductwork and building automation. In other words, every firm draws its own line around which products count as HVAC, and the wider the line, the bigger the number.
- Circularity. When researching many of the numbers published online, you'll find circular reasoning without any clear source.
If you carefully map most figures to what they actually measure, the picture clears significantly and most numbers can make sense in the right context - they're just not "the market". We found contradicting numbers in syndicated market-research reports, which is why we attempt our own estimate below.
Bottom-up approach: Units times prices
When starting with what physically ships, we'd hope to get a market size estimate through AHRI's US unit shipments, times factory prices. There are many assumptions entering here, for instance on price via the Department of Energy's (DOE) price structures and, e.g., the mini-split volume from AHRI's public data (which has no usable ductless volumes).
| Residential line | Units | Approx. factory price | Value |
|---|---|---|---|
| Central AC outdoor units | 4.10M | $1,800 | $7.4B |
| Heat pump outdoor units | 3.64M | $2,300 | $8.4B |
| Indoor coils and air handlers (one per system, assumed) | 7.75M | $600 | $4.6B |
| Gas and oil furnaces | 3.28M | $1,100 | $3.6B |
| Ductless mini-splits | ca. 1.2M (assumed) | $1,200 | $1.4B |
| Residential, factory prices | ca. $25.4B |
The next step is to walk these numbers down the value chain. DOE's baseline wholesaler markup of about 1.36x gives $34.5B at distributor prices. Multiplying contractor margin and sales tax take the overall factor to about 2.25x (which is our reading of the DOE structure, range 2.1x to 2.4x), so about $57B installed.
As a cross-check by price, Angi's 2026 national average for an AC replacement is $5,978. Price 7.75M AC and heat pump systems at $6,000 (Angi's AC price, applied to heat pumps too), furnaces at $4,000 and mini-splits at $4,500 (both assumed), and you get $65.0B. Angi's prices are replacement jobs, and builders of course pay less, so we take the two methods as bounds, which eventually yields residential installed is about $57B to $65B, central $61B.
Estimating the commercial market is somewhat more challenging, as there is no public unit count for chillers, rooftop units or VRF systems, so we build it from $$.
Census's factory shipments came to about $65B in 2024. Taking out about $28B of residential equipment (by our method above), plus commercial refrigeration, fans and heating, leaves $22B to $28B of commercial HVAC at factory prices for 2025, of which about $6.5B is data-center cooling (more below). Markups depend on the job: about 2.6x on engineered, bid-out projects per DOE, less for national accounts and direct OEM sales. A blended 1.8x to 2.3x gives a commercial installed market of about $40B to $64B, central $50B.
Service is what's left over. IBISWorld's $158.4B of contractor revenue, minus about $61B of residential and $45B of commercial equipment, leaves about $52B. Add ca. $12–18B of service that OEMs book directly and you get $64B to $70B. Since this leftover shrinks whenever the equipment lines run high, we carry service as $50B to $70B, central $65B, which is the softest number in this article.
| Net end-customer spend, 2025 | Value |
|---|---|
| Residential installed | $57–65B (central $61B) |
| Commercial installed | $40–64B (central $50B) |
| Service, repair and other work | $50–70B (central $65B) |
| Total | ca. $175B (range $160–195B)⁶ |
⁶ The central values add up to about $176B. The extremes of each line can't all happen at once, so $160–195B is our judgment of the plausible range.
How does this compare to a top-down estimate? IBISWorld's contractor revenue plus OEM direct service gives about $173B, close to our $176B. That match is partly built in, though, since we computed service from the same contractor figure. Census's combined plumbing and HVAC contractor receipts ($297.6B in 2022) suggest $150B to $165B for HVAC alone, using a share we borrow from IBISWorld. If anything, our residential line is more likely high than low: about 82M homes with central AC or a heat pump, replaced every 15 to 18 years, need fewer systems a year than AHRI shipped. Then the difference simply moves into service, and the total barely changes.
The data-center slice
2025 had an odd twist. AHRI's residential AC and heat pump shipments fell 20%, while Census factory shipments in dollars rose about 10%. Part of that is price, as the switch to new A2L refrigerants made systems about 8% more expensive (Watsco). The rest is data centers: AAON's data-center brand BASX grew 143.5% while the AAON brand fell 8.3%, and Carrier's commercial business in the Americas grew 23% while its residential volume fell 9%.
By our estimate, US customers spent about $16.5B on data-center cooling in 2025 (range $13B to $21B), i.e. roughly 9.4% of the $175B, as part of it, not on top.
| US data-center cooling, 2025 (our estimates) | Value | vs. 2024 |
|---|---|---|
| Air-side and heat-rejection equipment (air handlers, chillers, dry coolers, cooling towers) | ca. $4.9B | +40% |
| Liquid-cooling equipment (coolant distribution units, cold plates, immersion tanks) | ca. $1.6B | +100% |
| Installation | ca. $7.5B | +45% |
| Service and maintenance | ca. $2.5B | +25% |
| Total end-customer spend | ca. $16.5B⁷ | +45% |
⁷ No public source sizes US data-center cooling, so we scale Omdia's and Dell'Oro's global figures (North America 40–45% of the world, the US 90% of North America) and check against company disclosures and per-megawatt build costs. Treat all of it as ±25%.
Practically, this means data centers carried the market in 2025. Of the ca. $5.2B that commercial installed spend grew, about $4.5B came from data centers, while residential fell about 10%. Without data centers, the US market would have shrunk 2–3% instead of growing about 1%.
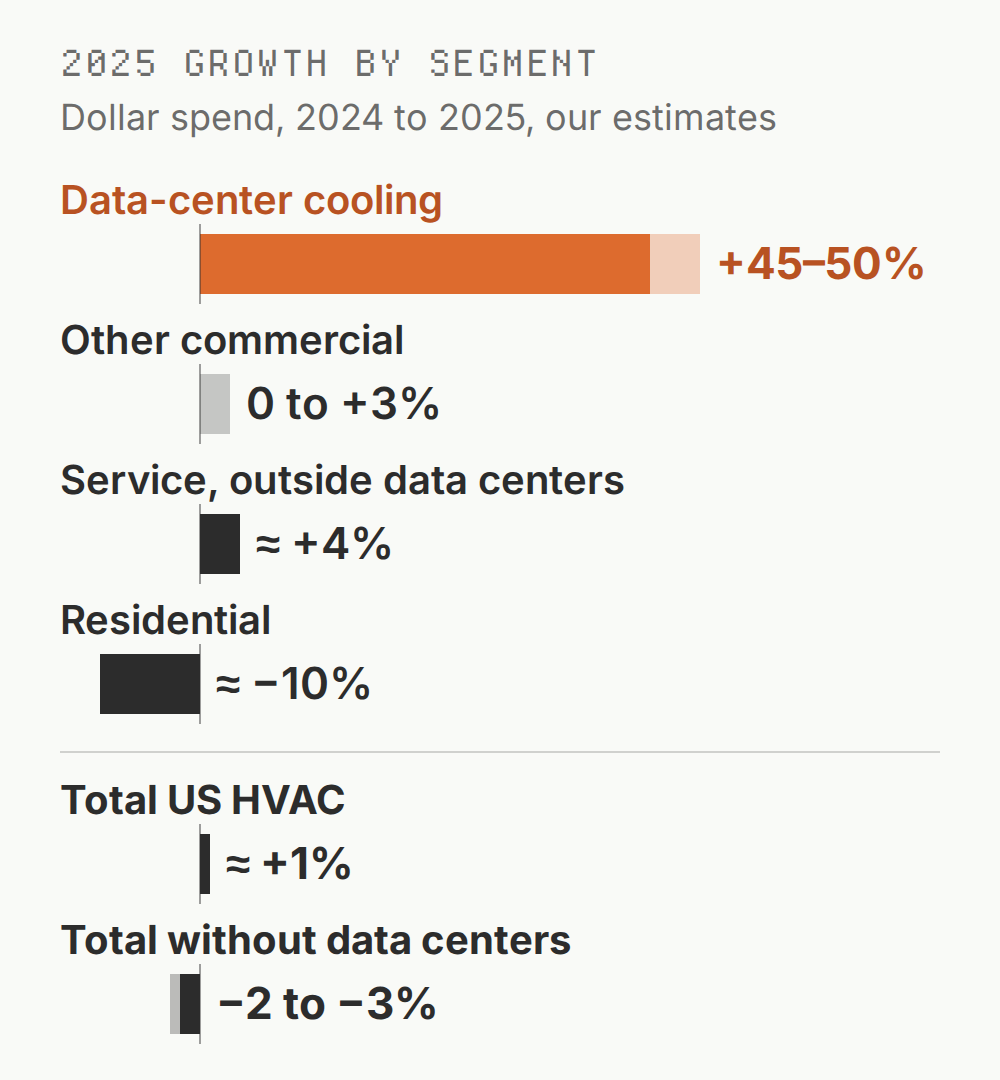
Change in US HVAC dollar spend by segment, 2024 to 2025. Source: Embarcadero Labs estimates from AHRI, Dell'Oro and company filings.
The companies say the same. Carrier "doubled our global data center revenue to $1 billion in 2025", Trane's bookings for large systems such as chillers in the Americas rose more than 100% for a fourth straight quarter, and Comfort Systems, a mechanical contractor, got 45% of its 2025 revenue from technology work, mostly data centers.
Does liquid cooling make HVAC obsolete here? Not quite. AI racks draw 60–120 kW, against about 15 kW for an average rack, so new halls pipe liquid to the chips, but that liquid still hands its heat to chillers, dry coolers or cooling towers. The risk is to chillers specifically: in January 2026, NVIDIA's Jensen Huang said that "at 45 degrees Celsius, the data center doesn't need a chiller", and the next day Johnson Controls fell 7.5%, Trane 5.3% and Carrier 1.1%.
Where does this go? CBRE counts a record 7,481 MW under construction in North America in the first half of 2026, more than 80% of it already leased. If data-center cooling grows 35% in 2026, slowing to 10% by 2030, and the rest of HVAC grows 3.5% a year, data centers reach about 17% (13–21%⁸) of US HVAC in 2030. That's a projection, of course, and delays in power and permits or cuts in AI spending would lower it.
⁸ Low and high cases of $28B and $50B, on ca. $188B for the rest of HVAC: 28 / (188 + 28) = 13%; 50 / (188 + 50) = 21%.
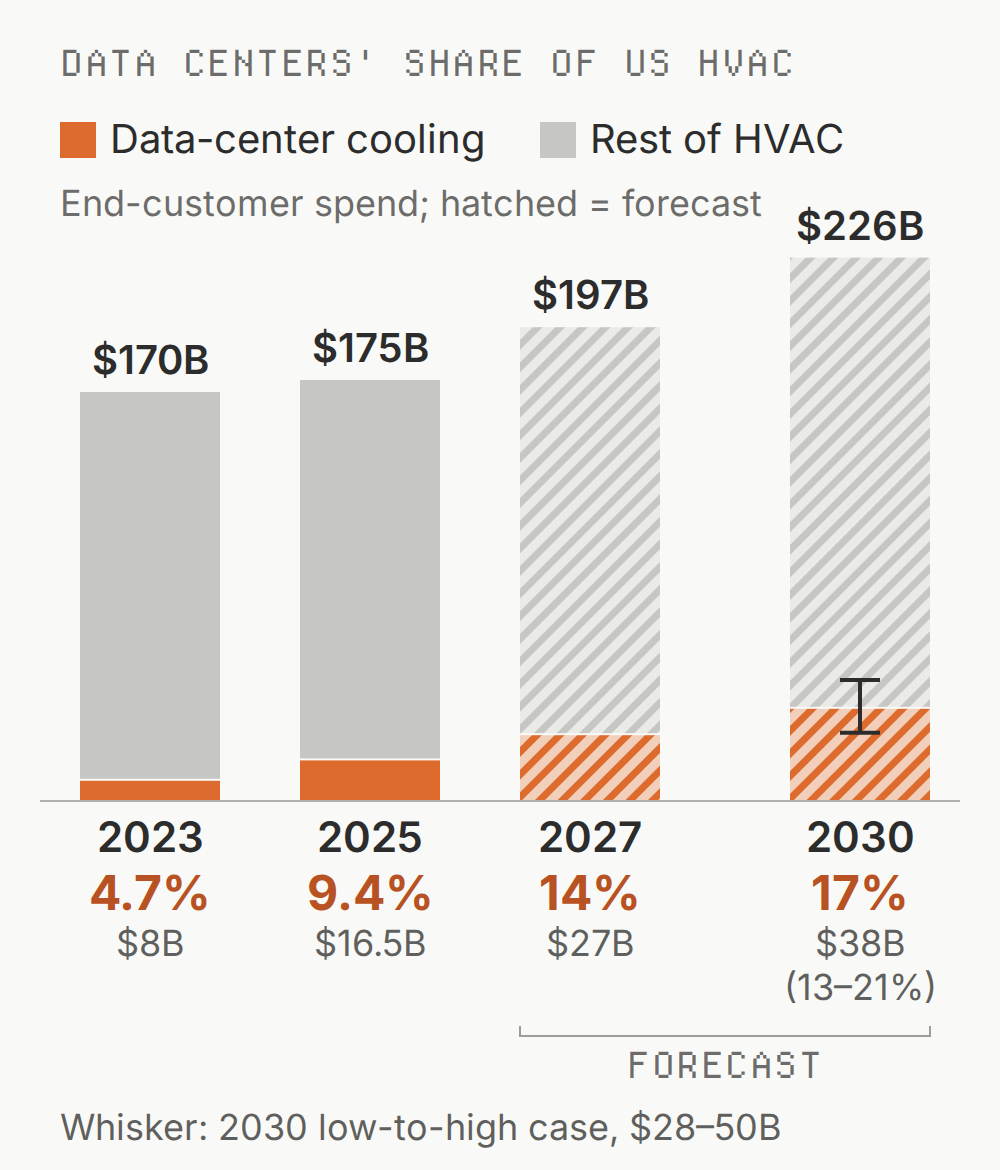
Data-center cooling as a share of US HVAC end-customer spend; 2027 and 2030 are forecasts. Source: Embarcadero Labs estimates from CBRE, Dell'Oro, Omdia and company filings.
Who does the work?
The usual story is that HVAC technicians are aging and the trade is 110,000 people short. As far as we can tell, that number goes back to a 2022 trade-show talk reported by ACHR News, with no source or method, at a time when the Bureau of Labor Statistics (BLS) counted more than 415,000 technicians. Blogs still cite it.
Federal data tell a calmer story. BLS counts 440,900 HVAC technicians in 2025, up from 425,200 in 2024, and projects 11% growth by 2035. Of its 40,600 openings a year, about 35,800 replace people who leave, which is about 8% of technicians a year and less than the 9.7% average across all jobs. Schools and apprenticeships supply about 25,000 new entrants a year, and the remaining ca. 15,000 are likely hired and trained on the job, which nobody measures.
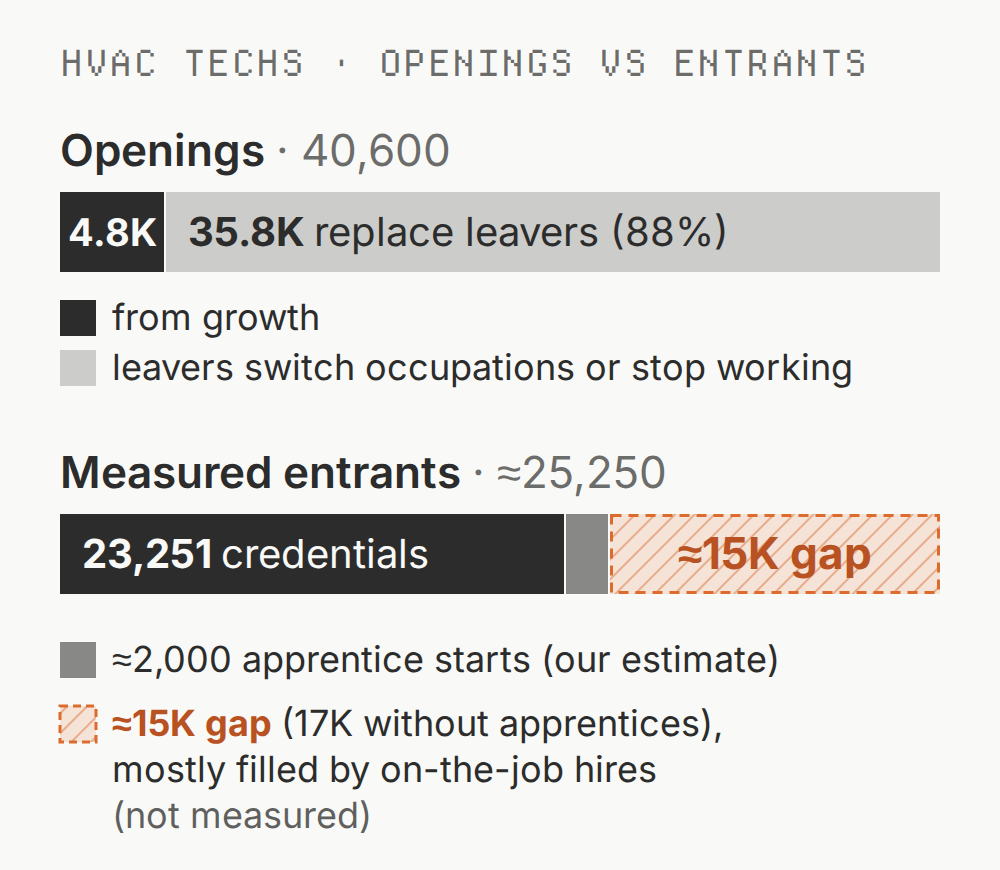
HVAC technician openings vs. measured new entrants, per year. Sources: BLS Employment Projections 2025–35; IPEDS 2023–24 (via The HVAC Brief); DOL apprenticeship data FY2021; own calculations.
The trade is also younger than average (median age 39.9, against 42.1 for all workers), so a retirement cliff isn't its main problem. And pay doesn't point to an acute shortage: the median HVAC wage rose 2.0% in the year to May 2025, against 3.0% for all occupations. A broad shortage would push HVAC pay ahead, not behind.
The real crunch is on data-center sites, where builders are so short of electricians, pipefitters and supervisors that some turn away work. Posted pay for electricians rose 4.6% in the year to May 2026, and up to 9.9% for commercial electricians, against 3.4% for construction overall.
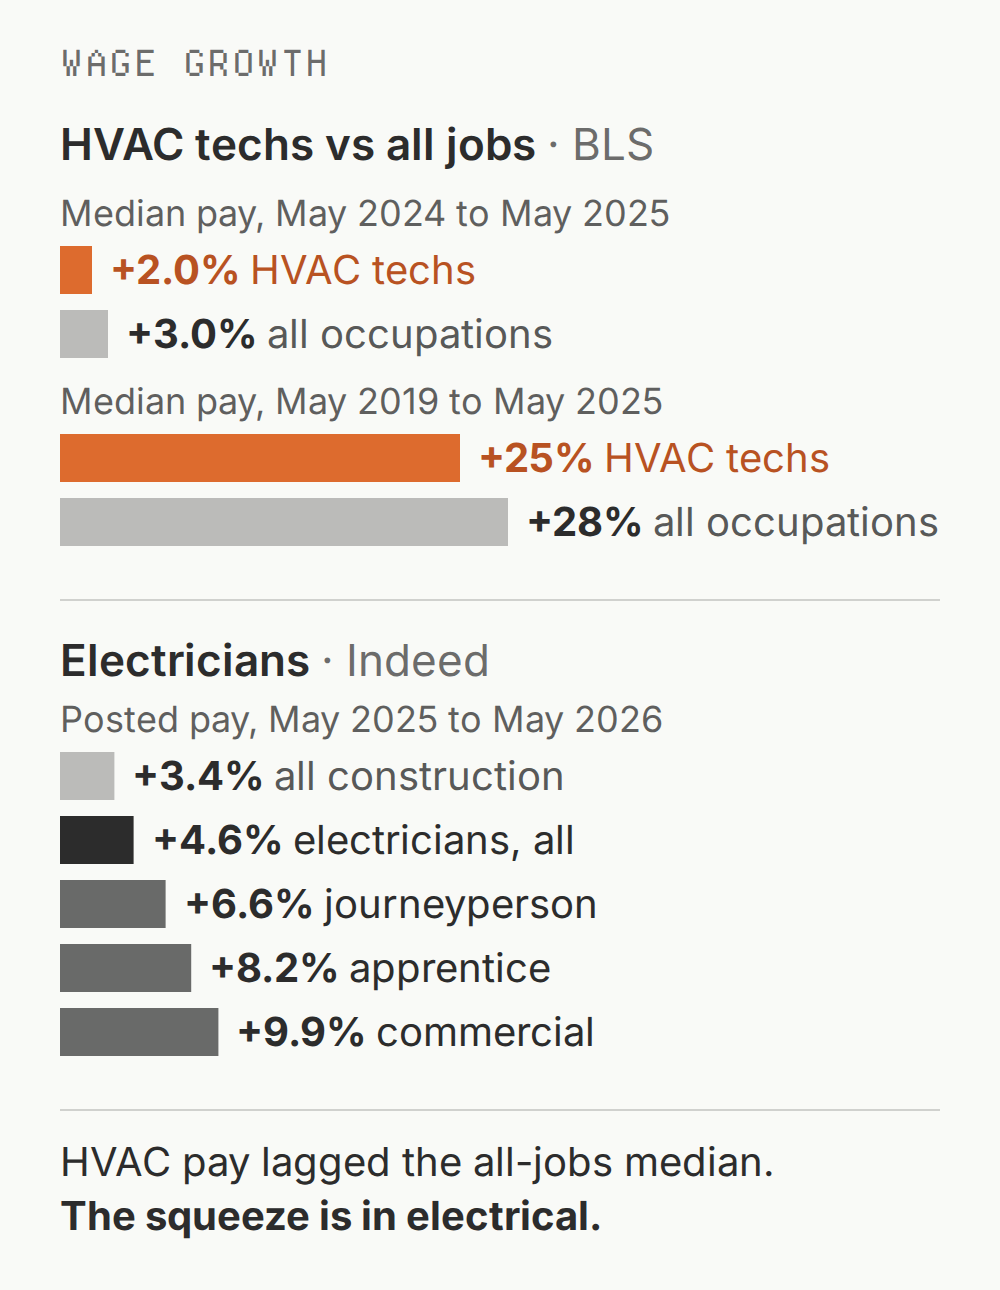
Wage growth, HVAC technicians and electricians vs. benchmarks. Sources: BLS Occupational Employment and Wage Statistics (OEWS), May 2019, 2024 and 2025 (own calc); Indeed posted pay via Bloomberg/Insurance Journal, July 2026. The panels use different sources and periods.
So what the trade lacks is less headcount than experience: new hires can be found, but seasoned commercial technicians take years to develop.
Summary
So, exactly how large is the US HVAC market? If you mean what customers pay, our estimate is about $175B for 2025. If someone quotes $45B or $300B, it's worth asking which layer they're counting. About a tenth of it is data-center cooling, which carried the market's growth in 2025, and roughly a third is service and repair, done one job at a time by the same 440,900 technicians who install the equipment. What they lack most is experience, not headcount. They're who we build Ten4 for, an AR-enabled AI assistant for frontline trades workers.
Sources
- Contractor revenue, $158.4B (2025). IBISWorld, Heating & Air-Conditioning Contractors in the US
- AHRI 2025 unit shipments, −20.0%. Contracting Business, "Breaking Down AHRI's 2025 Year-End Shipment Numbers"
- Census M3 factory shipments, NAICS 3334. FRED, series U33HVS
- Census AIES, NAICS 333415, $47.4B (2024). FRED, series AIES333415RCTUS
- Watsco: $74B North American market; ducted residential units −18%, prices +8%. Form 8-K, Form 10-K and Distribution Strategy Group
- IBISWorld's two wholesale figures. Market size page ($105.9B) and industry page ($76.0B)
- Mordor's US HVAC equipment figure, $45.5B (2024). Mordor reports on MarketResearch.com
- Freedonia's $20.7B (2018). Freedonia, HVAC Equipment
- DOE distribution markups. DOE, markups for equipment price determination and LBNL, price determination and markups
- AC replacement averages $5,978. Angi, "How Much Does AC Replacement Cost?"
- Census NAICS 238220, $297.6B (2022), via a secondary aggregator. Vanta Insights
- Installed base, ca. 82M homes with central AC or a heat pump. EIA, Residential Energy Consumption Survey (RECS) 2020.
- Carrier: commercial +23%, residential volume −9%. Carrier Form 10-K, FY2025
- AAON's BASX +143.5%. AAON Form 10-K, FY2025
- Carrier: "doubled our global data center revenue to $1 billion in 2025." Carrier 2025 Annual Report. 2026 target raised to ca. $2B. Carrier Q2 2026 earnings call
- Trane: Americas applied bookings +130% in Q2 2026. Trane Technologies, Q2 2026 results (Form 8-K). The fourth straight quarter above 100%. Trane, Q2 2026 earnings call.
- Comfort Systems: technology 45% of 2025 revenue (33% in 2024). Q4 2025 earnings call
- 7,481 MW under construction (H1 2026, +24.8% vs. end-2025); over 80% preleased. CBRE, North America Data Center Trends H1 2026 and press release
- Basis for our data-center estimate: global liquid cooling ca. $3B in 2025, roughly doubling. Dell'Oro Group. Rack densities; 20% a year for global thermal management to 2030. Dell'Oro Group, 2025–26. Global data-center thermal management, $7.67B (2023). Omdia, June 2024.
- Huang: "at 45 degrees Celsius, the data center doesn't need a chiller." Facilities Dive, "No chillers needed for Vera Rubin server racks: Nvidia CEO"
- Johnson Controls −7.5%, Trane −5.3%, Carrier −1.1%. Reuters, "Data center cooling-related stocks drop after Nvidia CEO Huang's comments" (Jan 6, 2026), via MarketScreener
- "110,000 unfilled HVAC technician jobs." ACHR News, "HVACR Industry Must Work Harder to Retain Technicians"
- 440,900 HVAC and refrigeration technicians (2025); +11% by 2035; 40,600 openings a year. BLS Occupational Outlook Handbook
- Separation rates, all occupations. BLS Employment Projections, Table 1.10
- 23,251 HVAC credentials (2023–24). NCES IPEDS completions, as analyzed by The HVAC Brief. 8,050 active HVAC apprentices (FY2021). US Department of Labor, Employment and Training Administration.
- HVAC techs' median age 39.9; 55 and older 18.7% (our calculation). BLS Current Population Survey, Table 11b (2025)
- Median pay, HVAC techs and all occupations, May 2019, 2024 and 2025. BLS Occupational Employment and Wage Statistics: HVAC mechanics and installers and all occupations
- Data-center labor: electricians, pipefitters, supervisors; Sterling "stealing" crews; Indeed posted-pay growth, May 2025 to May 2026 (electricians 4.6%; journeyperson, apprentice and commercial electricians 6.6%, 8.2% and 9.9%; construction 3.4%). Bloomberg via Insurance Journal, "Labor Crunch Tests Growth Limits for US Data Center Builders" (July 8, 2026)
Nota bene: This is our reading of public data as of October 2026, not investment advice. The $175B is our own estimate and rests on assumed factory prices, an assumed mini-split volume, blended commercial markups and a service line computed as what's left over. The data-center figures are our estimates too, and the 2027 and 2030 shares are projections based on company guidance and analyst forecasts.
Get in touch
Run a field operation? Let's talk.
We're rolling out Ten4, our AI assistant for frontline trades workers, with a small set of partners. If this sounds like a problem you have, we'd love to hear from you.